 |
Hari Srinivas |
|
Case Study Series E-120.
|

The blue line indicates the limit of Tokyo as defined in this write-up
|
The ecological footprint of a city is the biologically productive land and sea area required to provide the food, energy, materials and other resources consumed by its residents, and to absorb the wastes and emissions generated by their lifestyles. Although cities occupy only a small proportion of the Earth's surface, they depend on ecosystems located far beyond their own boundaries.
For this discussion, "Tokyo" refers to the Greater Tokyo Area (Shuto-ken), comprising the Tokyo Metropolis together with the surrounding prefectures of Kanagawa, Saitama and Chiba. With an estimated population of approximately 37.4 million in 2025, it remains the world's largest metropolitan region.
Japan has a total land area of approximately 378,000 km2 (37.8 million hectares). However, because around two thirds of the country is mountainous or otherwise unsuitable for settlement or agriculture, the habitable land area is only about 122,000 km2 (12.2 million hectares).
Tokyo's ecological demand
According to the latest National Footprint and Biocapacity Accounts of the Global Footprint Network, the average Japanese lifestyle requires approximately 4.3 global hectares (gha) of biologically productive land and sea per person, while Japan's own ecosystems provide only about 0.6 gha per person. The resulting ecological deficit of approximately 3.7 gha per person is met through imports, overseas production, and the use of global ecological resources.
Applying the national ecological deficit to the Greater Tokyo Area illustrates the scale of resources required to support just one metropolitan region.
Assuming an ecological deficit of approximately 4.4 global hectares per person and a metropolitan population of 37.4 million people, Tokyo's ecological deficit amounts to roughly 163 million global hectares.
This is equivalent to:
- approximately 4.3 times the total land area of Japan, or
- approximately 13 times Japan's habitable land area.
These figures do not imply that Tokyo physically occupies this much land. Rather, they illustrate the extent to which the city's resource consumption and waste assimilation depend upon land resources and ecosystems distributed throughout Japan and across the world.
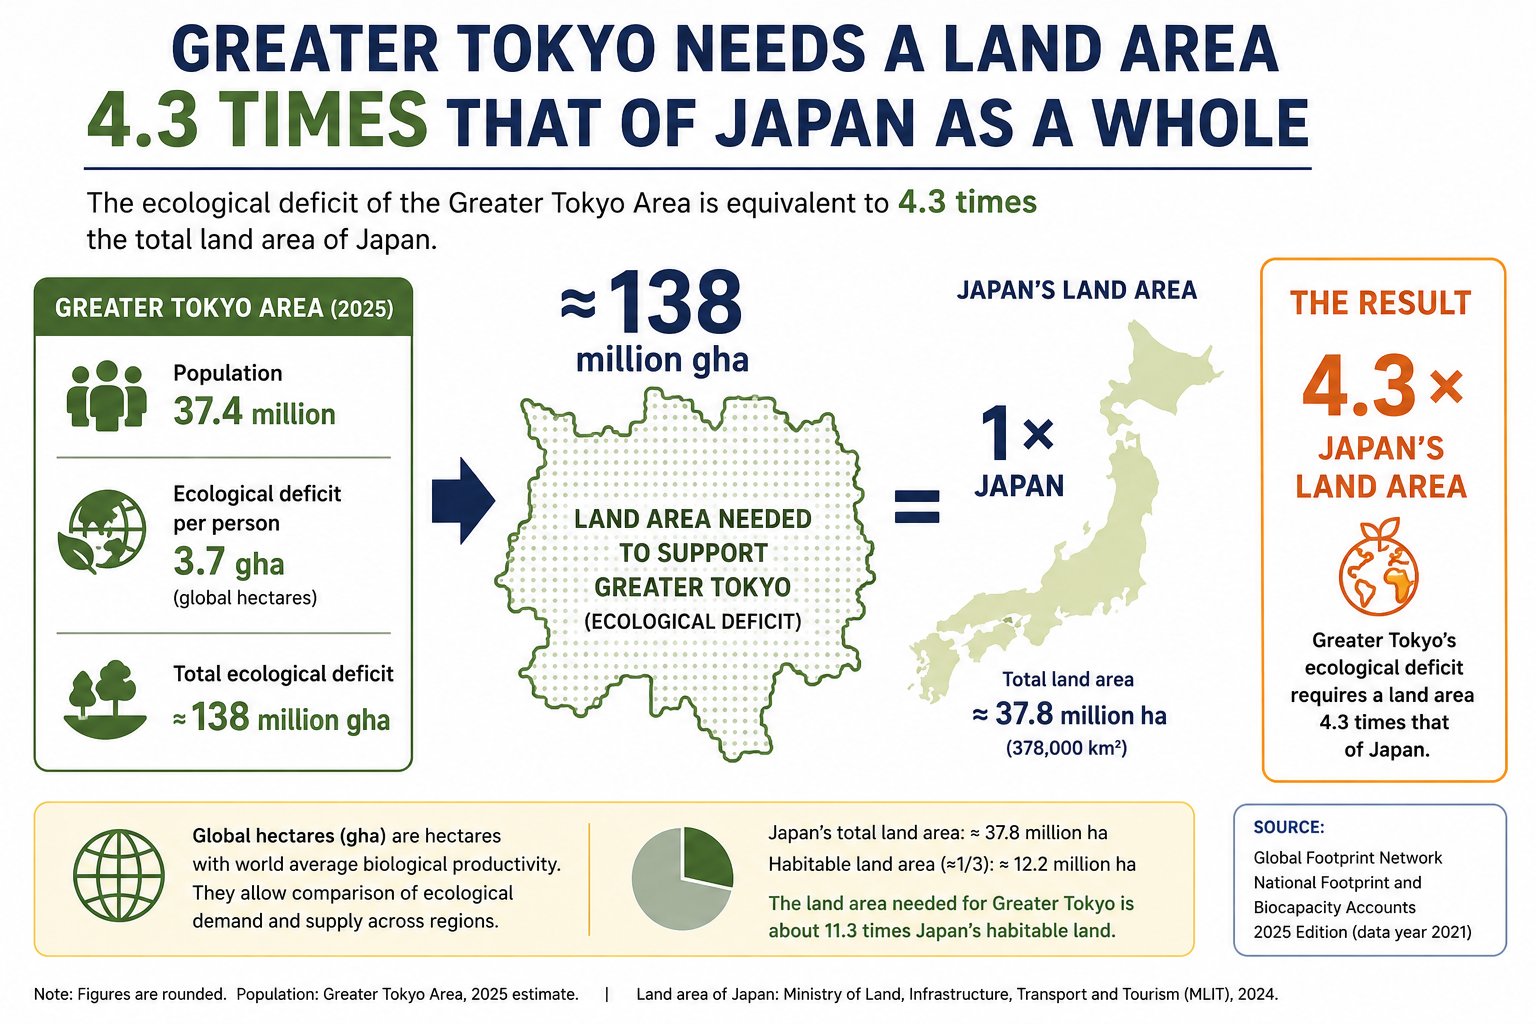
Figure 1: Tokyo's Ecological Footprint
Source: GDRC concept, diagram visualised with AI tools and edited by author
Multiple ways of measuring ecological footprints
Ecological footprints can be estimated using several different approaches.
One method compares the biologically productive area required for sustainable living with the available global biocapacity.
Another compares a country's ecological demand with its domestic biocapacity to estimate its ecological deficit.
Other studies estimate the land required to produce food, timber, fibre, energy and carbon sequestration separately before combining them into an overall footprint.
Each approach produces different numerical values because they are based on different assumptions, datasets and definitions. The precise numbers are therefore less important than the overall message: modern metropolitan regions depend upon ecological resources that extend far beyond their own geographic boundaries.
Food and resource dependence
Japan's food self sufficiency rate on a calorie basis remains among the lowest of the major industrial economies, with roughly two thirds of food calories supplied through imports. Consequently, the ecological footprint of Tokyo extends well beyond Japan's borders through international trade in food, timber, minerals, manufactured goods and energy.
Similarly, much of the waste generated by the Tokyo metropolitan region is processed, recycled, incinerated or disposed of outside the central city, extending its environmental footprint across neighbouring prefectures.
Understanding ecological footprints
Ecological footprints should not be interpreted as exact measurements. Results vary according to the methodology, the spatial scale being analysed and the assumptions used in the calculations. Instead, footprints are best viewed as an educational and policy tool that helps visualise the relationship between consumption and the Earth's ecological capacity.
They are particularly useful for:
- raising awareness of the environmental implications of urban lifestyles;
- exploring future scenarios by examining how changes in consumption, technology or policy affect resource demand; and
- monitoring progress towards more sustainable patterns of production and consumption.
A note on compact cities
One important limitation of conventional ecological footprint analysis is that it does not adequately recognise the efficiency of compact urban development.
Tokyo is one of the world's densest metropolitan areas. Residential, commercial and transport functions are layered vertically through high rise buildings, underground infrastructure and intensive mixed land use. High density development reduces per capita land consumption, shortens travel distances and lowers infrastructure requirements compared with dispersed urban forms.
Future ecological footprint methodologies could better reflect these differences by incorporating indicators of land use efficiency, urban compactness and infrastructure intensity. In this respect, Tokyo demonstrates that while a city may have a very large ecological footprint because of its population and consumption, it can also be among the most land efficient ways of accommodating large numbers of people.
But environmental footprints are not an 'exact science'. As we saw above, different definitions can provide different footprints. It also depends on issues of scale in which it is measured - city, nation, region. Besides, excess footprints for small, developed nations are inevitable.
Footprints are useful, however from three points of view:
- to shock, to generate awareness - focussing on urban lifestyles and living, resource utlization etc.
- to build scenarios: if criteria used to define the footpirnts are changed, or resource utilization reduced, how does it affect the footprints?
- to evaluate and monitor policies and programmes. What footprints have particular policies and programmes generated? If their structure is changed/modified, or new policies put inplace, how are footprints affected?
|
|
| * |
A global hectare (gha) is a hectare with world average biological productivity. It provides a common unit for comparing the ecological demand (Ecological Footprint) and ecological supply (biocapacity) of different countries and regions. |
|
Footnote on footprints
|
|
When a city's footprint is counted, the amount of area 'artificialy' produced is usually overlooked. Having a large field with two country houses occupying the whole surface is not the same as having two houses in the same field in a compact two-storey building freeing the remaining space for agricultural and other purposes.
Tokyo is a city where the land is used several times at several levels, more than any other citiy in the world. Due to the extreme density, they use roof toops, overbulid four levels of transport aboveground, dig large cities underground (In some areas of Tokyo, this extends seven stories underground!), and use spaces 24 hours a day.
If all these variables were used to compute the ecological footprint, the difference between very high density cities and extended cities - like those in the US - would be three or four times greater.
A second point is that understanding ecological footprints will also have to take into account this 'efficiency' of land use and compactness of Tokyo. Compact cities such as Tokyo have a large population living in a very small and dense area of land, freeing land area for other purposes. It also reduces the amount of infrastructure needed to service them, and resources needed for everyday living, rather than having them spread out over a vast area.
- with inputs from Iv�n Villarrubia Lorenzo
|
References
- BoE (2012) "Current status of industrial waste." Tokyo: Bureau of the Environment, Tokyo Metropolitan Government. http://www.kankyo.metro.tokyo.jp/resource/industrial_waste/about_industrial_waste/about_03/index.html
- Earth Council "Ecological Footprints of Nations" San Jos�E Costa Rica: Earth Council http://www.ecouncil.ac.cr./rio/focus/report/english/footprint/
- MAFF (2018), "The 92nd Statistical Yearbook of the Ministry of Agriculture, Forestry and Fisheries" Tokyo: Ministry of Agriculture, Forestry and Fisheries. https://www.maff.go.jp/e/data/stat/92nd/index.html
- WWF (2009), "Japan Ecological Footprint Report"
Worldwide Fund for Nature. https://d2ouvy59p0dg6k.cloudfront.net/downloads/wwf_efj_2009e.pdf
|