Healthy Cities
Integrating the Brown Agenda into the Healthy Cities Concept:
A Remedial Equity Framework
Hari Srinivas Concept Note Series C-135

Abstract:
Health is a cornerstone of sustainable development, influenced by the complex interactions between environmental quality, social conditions, economic well-being, and effective governance. While traditional environmental health concerns, often referred to as the "Brown Agenda", continue to pose significant challenges, emerging issues such as climate change, urbanization, ageing populations, mental health, and pandemic preparedness have expanded the scope of public health policy. Addressing these challenges requires integrated approaches that link health with water, sanitation, food systems, energy, housing, transport, and resilient urban planning.By promoting healthy environments and equitable access to essential services, governments, communities, and other stakeholders can improve quality of life while advancing broader sustainability objectives. This resource explores the connections between health and sustainable development, highlighting key concepts, policy responses, and practical examples that support healthier and more resilient societies.
Keywords:
health, sustainable development, environmental health, healthy cities, public health, climate change, urban resilience, Brown Agenda
1. Introduction
H Health is both an outcome and a driver of sustainable development. Healthy populations contribute to resilient communities, productive economies, and environmentally sustainable societies. At the same time, environmental degradation, climate change, urbanization, and inequality directly influence human health.
The WHO's Healthy Cities framework emphasizes equity as a core value. The Brown Agenda operationalizes this by identifying exactly where that equity is compromised. By linking them, it can be argued that localized pollution is not just an infrastructure failure, but a direct violation of the right to health. For instance, addressing the unequal distribution of waste facilities or particulate matter (PM2.5) in low-income neighborhoods becomes a primary medical intervention, not just an urban planning choice.
he contemporary Healthy Cities movement frequently emphasizes long-term ecological sustainability and lifestyle enhancements - such as green spaces, active transit corridors, and urban biodiversity (often categorized as the "Green Agenda"). While valuable, this focus can inadvertently create a "green bias" in urban planning, obscuring immediate, life-threatening environmental hazards that disproportionately impact marginalized populations.
In contrast, the Brown Agenda focuses on the immediate, severe environmental risks that directly jeopardize human health, specifically targeting urban issues such as unsafe drinking water, inadequate sanitation, poor housing, indoor and outdoor air pollution, hazardous waste, and occupational health risks.. Low-income neighborhoods and informal settlements bear an unequal distribution of these burdens, facing systemic exposure to toxic, hazardous vectors and severe infrastructural deficits. These issues are often discussed under themes such as Environmental Health, Urban Health, Planetary Health, or One Health.
A city cannot be genuinely "healthy" if its foundational environmental health protections are fractured along socioeconomic lines. If the Healthy Cities movement is the overarching vision for urban well-being, then the Brown Agenda provides the non-negotiable baseline. Indeed, a truly "Healthy City" cannot be built on a foundation of environmental injustice.
This concept note outlines a strategic framework to structurally link the Brown Agenda with the Healthy Cities model. The Core Thesis that we need to consider is that the Brown Agenda shifts the Healthy Cities framework from an aspirational wellness model to a remedial equity model. It asserts that public health interventions must start where environmental degradation is most acute.
Table 1: Definition of Healthy Cities, Green Agenda and Brown Agenda
Healthy Cities
Healthy Cities is an approach to urban development that puts health, well-being and equity at the centre of city decision-making. It is a continuing process of improving physical and social environments, services, and community capacity-not simply a city that has reached a particular health standard.Green Agenda
Green Agenda concerns the protection and restoration of urban and surrounding natural systems. It includes green space, biodiversity, urban forests, land and ecosystem management, recognizing that nature supports climate resilience, ecological balance and quality of life.Brown Agenda
Brown Agenda concerns immediate environmental health risks, especially those borne disproportionately by low-income and densely populated communities. Its priorities include sanitation, safe water, waste management, air and water pollution control, and reducing exposure to hazardous substances-making it a direct bridge between environmental management and Healthy Cities.
2. Conceptual Framework: Redefining Urban Determinants of Health
Integrating these two agendas requires redefining the standard physical and social determinants of health. Urban management must transition from evaluating city-wide environmental averages to mapping highly localized, chemical-physical health determinants.
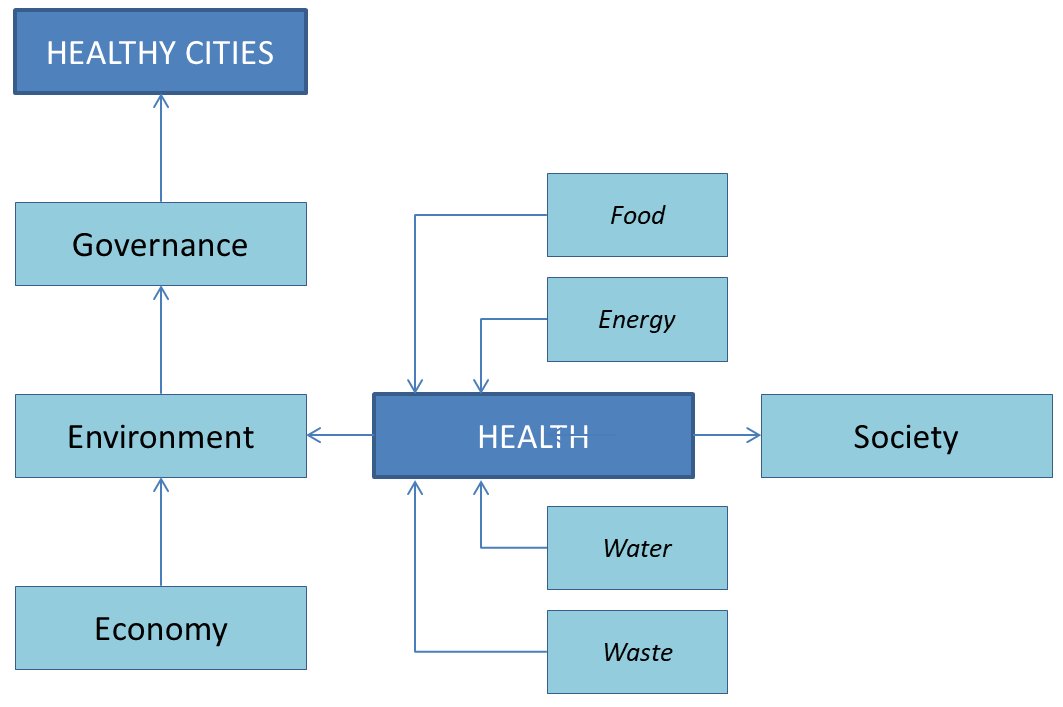
Figure 1: Thematic Map: Healthy Cities and the Brown AgendaThe matrix below illustrates this conceptual shift, repositioning traditional wellness priorities through an environmental justice lens:
Table 2: Healthy Cities and the Brown Agenda
Traditional Healthy Cities Focus Integrated Brown Agenda Lens Active Living: Walkability and recreational parks. Toxic Exposure: Is the soil in that park contaminated with heavy metals? Is the air along the walking route safe to breathe? Nutritional Health: Access to fresh food and reducing food deserts. Safe Infrastructure: Is the water delivering that food free of lead? Are local food markets free of chemical vectors? Healthcare Access: Proximity to clinics and hospitals. Preventative Remediation: Eliminating the localized land and air pollution that causes the chronic respiratory illness in the first place. 3. Operational Framework: The Core Indicators Dashboard
Urban managers often suffer from "green bias" - prioritizing long-term ecological sustainability (the Green Agenda, like reducing carbon footprints or protecting urban biodiversity) because it is politically popular.Linking Healthy Cities to the Brown Agenda forces a pivot toward immediate human suffering. It demands that a city allocate resources to fix broken sewage systems in marginalized neighborhoods before, or alongside, investing in high-tech smart-city grids downtown.
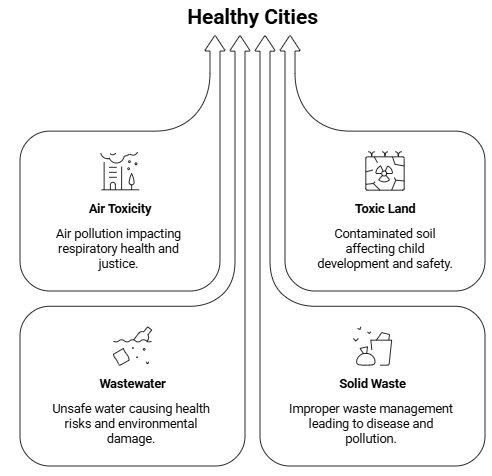
Figure 2: Components of a Brown Agenda Dashboard
Policy Focus
Healthy communities require integrated action across multiple sectors.Priority areas include:
- Safe drinking water
- Sanitation
- Air quality
- Housing
- Climate resilience
- Food systems
- Active transport
- Universal health access
- Digital health
- Community participation
A hallmark of the Healthy Cities movement is breaking down bureaucratic silos. Linking it to the Brown Agenda provides a concrete roadmap for doing this. It forces, for example, the Department of Public Health to co-manage zoning laws, waste management, and industrial permitting alongside a city's Environmental Protection agencies. Health equity becomes the metric by which environmental engineering success is measured.
Building an urban dashboard that merges the Brown Agenda with the Healthy Cities framework requires shifting away from "city-wide averages." City-wide data routinely hides localized variations. If the city's average air quality is "moderate," but a low-income neighborhood adjacent to an industrial zone experiences toxic spikes daily, a standard dashboard fails to focus on these localized hotspots.
An integrated dashboard must pair environmental hazard mapping (the Brown Agenda) directly with localized public health outcomes (Healthy Cities), disaggregated by neighborhood or socioeconomic status.
To translate this integrated theory into actionable urban governance, municipalities must deploy a geospatial data dashboard. Rather than relying on aggregate municipal statistics, data must be disaggregated by neighborhood, income quintile, or demographic profile to reveal hidden exposure disparities.
Table 3: Healthy Cities Dashboard Metrics
Thematic Area Brown Agenda Metric
(The Environmental Hazard)Healthy Cities Outcome
(The Public Health Impact)Equity Disaggregation Metric
(The Environmental Justice Lens)1. Air Toxicity and Respiratory Justice Micro-level ambient air pollution: Daily PM2.5, NO2, and localized air toxics (e.g., benzene) monitored via high-density sensor arrays. Pediatric Asthma Burden: Incidence rates of emergency department (ED) visits and admissions for acute respiratory distress per 10,000 children. The Exposure Gap: The variance ratio of hazardous exposure and emergency medical admissions between the lowest and highest income quintiles. 2. Toxic Land and Child Development Brownfield and Lead Proximity: Spatial density of legacy/active industrial sites within 500m of residential zones; percentage of housing units with lead service lines. Pediatric Neuro-Vulnerability: Percentage of screened children under age 6 displaying blood lead levels exceeding 3.5 ?g/dL. Zoning Disparity Index: Demographic stratification (income, race, ethnicity) of populations residing within a 1km buffer of un-remediated toxic sites. 3. Wastewater amd Microbiological Safety Infrastructure Deficit: Annual frequency, volume, and location of combined sewer overflows (CSOs) or unpermitted wastewater discharges. Enteric Disease Incidence: Spatial reporting patterns of acute gastrointestinal infections and water-borne pathogens at neighborhood clinics. Infrastructure Response Time: Mean duration from utility fault notification to field resolution in informal/low-income settlements versus affluent districts. 4. Solid Waste and Vector Density Proximity to Waste Sinks: Tonnage of municipal, electronic, or hazardous industrial waste processed, stored, or illegally abandoned per km2. Vector-Borne and Infectious Risk: Field density maps of biological vectors (rodents, mosquitoes) and associated outbreaks of infectious diseases. Service Allocation Disparity: Weekly municipal refuse collection frequencies and unresolved waste clearing backlogs cross-referenced by neighborhood. 4. Integrated Metrics for Policy Evaluation
To convert dashboard indicators into regulatory mechanisms, urban administrations should adopt three advanced analytical tools:
Table 4: Three Advanced Analytical Tools
Intersectoral Health Vulnerability Index (IHVI) How it works:
The IHVI synthesizes standard Social Vulnerability Indices (SVI) - such as poverty line status, linguistic isolation, and lack of healthcare access - with a localized "Brown Score" (cumulative toxic loads across air, water, and soil).The Utility Value:
This index identifies compounding vulnerability zones, guiding health authorities to deploy targeted clinical interventions and screening networks.Direct Attribution Ratio (DAR) How it works:
The DAR utilizes localized epidemiological tracking to identify specific health anomalies that correlate directly with point-source environmental hazards (e.g., assessing spike patterns in cardiovascular events immediately downwind of localized industrial zones).The Utility Value:
This ratio provides environmental protection authorities with the empirical framework required to enforce municipal zoning regulations, issue targeted fines, or suspend operating permits.Green-to-Brown Resource Allocation Ratio How it works:
An internal administrative metric that evaluates a municipality's capital expenditure allocation. It calculates capital spent on "Green" lifestyle interventions (e.g., aesthetic waterfront revetments, downtown civic spaces) against capital directed toward "Brown" remedial infrastructure (e.g., replacing lead service pipes, installing industrial air buffers, upgrading wastewater networks in vulnerable neighborhoods).The Utility Value:
This metric serves as an accountability measure to prevent municipal greenwashing to secure basic health security, particularly for marginalized citizens.5. Strategic Institutional Alignment
Executing this integrated framework demands a restructuring of typical municipal workflows:
What can cities do?
- Improve air quality.
- Expand walking and cycling.
- Increase access to parks.
- Ensure safe drinking water.
- Improve sanitation.
- Reduce exposure to hazardous waste.
- Integrate health into urban planning.
- Monitor environmental health indicators.
- Strengthen community participation.
- Integrating Municipal Bureaucracy: Establishing a unified Environmental Health Taskforce that explicitly links the Department of Public Health with the Bureau of Environmental Engineering and Urban Planning.
- Health-in-All-Policies (HiAP) Mandate: Requiring environmental justice impact statements and localized health risk assessments for all prospective urban zoning, industrial permitting, and infrastructural adjustments.
- Participatory Environmental Monitoring: Provisioning community-led monitoring programs with calibrated, low-cost sensor technologies to actively engage marginalized neighborhoods in the generation and oversight of dashboard data.
Implications: Way forward
Protecting and promoting human health is fundamental to achieving sustainable development. As environmental, social, and economic systems become increasingly interconnected, health can no longer be viewed solely as the responsibility of the healthcare sector. Decisions on urban planning, water and sanitation, food systems, energy, transport, housing, education, and climate policy all have profound implications for the health and well-being of communities. Integrated, cross-sectoral approaches are therefore essential for creating environments that prevent disease, reduce inequalities, and improve quality of life for present and future generations.Looking ahead, emerging challenges such as climate change, population ageing, antimicrobial resistance, urbanization, and the increasing use of digital technologies and artificial intelligence will continue to reshape the relationship between health and sustainable development. Addressing these challenges will require innovation, collaboration, and informed public policy at every level. By placing health at the centre of sustainable development strategies, governments, businesses, civil society, and individuals can build more resilient, equitable, and sustainable communities that are better prepared for the opportunities and uncertainties of the future.
This work by GDRC is licensed under a Creative Commons Attribution-ShareAlike 4.0 International License. You are free to share and adapt this piece of work for your own purposes, as long as it is appropriately cited. More info: http://creativecommons.org/licenses/by-sa/4.0/
CITATION TEXT:



|
Return to Healthy Cities Contact: Hari Srinivas - [email protected] |